Simple Parabolic Telescope
import jax
import matplotlib.pyplot as plt

from iactrace import MCIntegrator, Telescope, show_telescope, squareshow
Loading the telescope from the basic configs:
telescope = Telescope.from_yaml('../../configs/BASIC/Parabolic.yaml', MCIntegrator(8192), jax.random.key(42))
We are in diffraction limited territory, which raytracing does not capture well. We add some mirror roughness to ‘fake’ seeing effects.
telescope = telescope.apply_roughness(1)
Visualizing the telescope:
scene = show_telescope(telescope)
scene.show(viewer='jupyter')
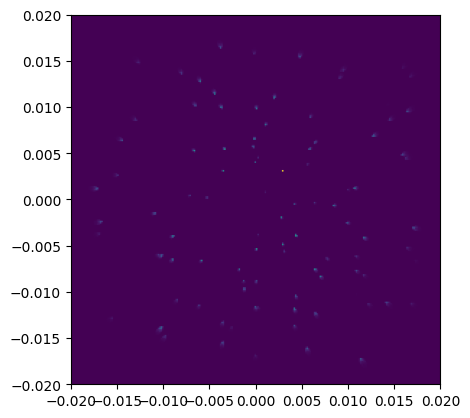
Simulating a star field:
# Generate star field
n_stars = 100
key = jax.random.key(42)
key1, key2 = jax.random.split(key)

# Small angular region (1 degree field of view)
fov_deg = 5
fov_rad = fov_deg * jax.numpy.pi / 180

x = jax.random.uniform(key1, (n_stars,), minval=-fov_rad/2, maxval=fov_rad/2)
y = jax.random.uniform(key2, (n_stars,), minval=-fov_rad/2, maxval=fov_rad/2)
z = -jax.numpy.ones(n_stars)

stars = jax.numpy.stack([x, y, z], axis=1)
stars = stars / jax.numpy.linalg.norm(stars, axis=1, keepdims=True)

# Set random flux values for stars:
key = jax.random.key(4242)
f_stars = jax.random.uniform(key, shape=(len(stars),))

# Render image on sensor:
image = telescope.render(stars, f_stars, source_type='parallel')

# Visualize result:
fig, ax = plt.subplots()
ax = squareshow(image, telescope.sensors[0], ax=ax)
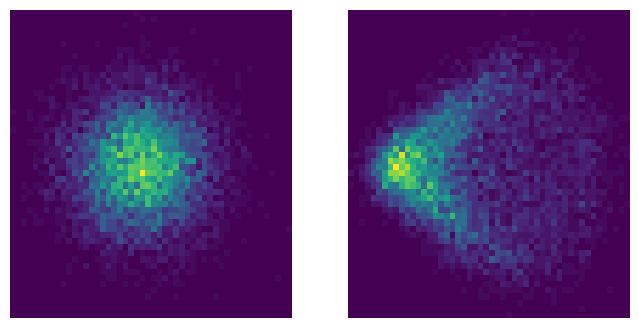
Creating spot diagrams:
Spot diagrams show the distribution of rays hitting the sensor for point sources at different field angles. For a parabolic mirror, on-axis sources focus to a point, while off-axis sources show coma aberration.
# Generate 2 stars at different offsets
stars = jax.numpy.array([[0,0,-1],[0.004,0.000,-1]])
stars = stars / jax.numpy.linalg.norm(stars, axis=1, keepdims=True)

# Give stars the same flux
f_stars = jax.numpy.array([1,1])

# Use debug render to get intersections:
points, sensor, weight = telescope.render(stars, f_stars, source_type='parallel', debug=True)
fig, ax = plt.subplots(ncols=2, figsize=(8,4))
chunks = jax.numpy.array_split(points, 2)
wchunks = jax.numpy.array_split(weight, 2)
for i, chunk in enumerate(chunks):
    ax[i].hist2d(chunk[:, 0], chunk[:, 1], weights=wchunks[i], bins=50)
    ax[i].axis('off')